
The Investment Gap in Copper Mining
The Investment Gap in Copper Mining

PAYNE INSTITUTE COMMENTARY SERIES: WORKING PAPER
I Payne Institute for Public Policy, Colorado School of Mines, USA
II University of Michigan, USA
III Department of Business and Economics, Colorado School of Mines, USA
IVIndependent Researcher
October 26, 2026
Abstract: Our recent paper on the supply demand gap in copper found that business-as-usual demand for mined copper reaches 37.1 million tonnes a year by 2050 and that mines operating in 2018 will supply only 17.8 million tonnes of that total. This paper uses a simple methodology that converts that physical shortfall into a capital (investment) requirement. The forward gap is calculated by taking 2050 mined demand less the 2050 output of the 2018 existing mines less the capacity added between 2018 and 2025. Mines opened or expanded since 2018 added about 3.2 million tonnes, leaving 16.1 million tonnes a year to be built. At the $22,359 per tonne average capital intensity of the 26 projects due to start by 2030, the requirement is about $360 billion in 2024 dollars. Unit cost dominates the uncertainty in this calculation. As a result, our calculation of the total ranges from between $304 billion to about $545 billion. Falling grades and deeper ore bodies are key to this gap. Leaching copper from existing stockpiles may be able to lower the figure. At $14 billion to $18 billion a year the requirement is within the industry’s recent spending, but there are many other constraints that need to be addressed from permitting, to capital costs, to community engagement.
Keywords: copper; capital intensity; mine investment; supply gap; critical minerals
Key findings
- Mines operating in 2018 will produce about 17.8 million tonnes of copper in 2050 compared to a baseline mined demand of 37.1 million tonnes. Mines opened or expanded since 2018 have added about 3.2 million tonnes, so about 16.1 million tonnes a year of new output remains to be built.
- At the $22,359 per tonne average capital intensity of the 26 copper projects due to start by 2030, building that output costs about $360 billion in 2024 dollars. Our full range, given various sensitivities goes from $304 billion to about $545 billion.
- BloombergNEF’s 2026 estimate of $332 billion, rests on a physical gap close to ours but on a capital intensity 26% below the pipeline average. It is, therefore, slightly below the low end of what we calculated.
- Money has been spent before at this scale at roughly $14 to $18 billion a year. The constraints, though, are significant to maintaining that momentum. They include complex issues of permitting, community consent, and a price that justifies the marginal project.
1. Introduction
Simon et al. (2026) projected that business-as-usual demand for mined copper reaches 37.1 million tonnes a year by 2050, that the mines operating in 2018 will produce 17.8 million tonnes in that year, and that the world’s mines will struggle to keep pace without a much higher copper price. In October, BloombergNEF (2026) published a figure of $332 billion for the new copper mines needed by 2050.
This paper converts the physical gap in Simon et al. (2026) into a capital requirement in a way that can be traced and repeated. The method is deliberately simple. The forward gap is 2050 mined demand less the 2050 output of mines operating in 2018 less the output added by mines opened or expanded between 2018 and 2025, the last built bottom-up from the papers porphyry database and company reports. The gap is then priced at capital intensities observed in the current project pipeline and in recent company disclosures, with every input listed by source and type in an accompanying workbook. The contribution is less the headline number than the decomposition around it: which drivers move the total and by how much, where the capital would fall geographically, how the result compares with the industry’s own spending, and why a bottom-up estimate and BloombergNEF’s differ.
Three further questions follow: Whether the known but undeveloped deposits could supply the balance that identified projects do not cover? Whether the rise in capital intensity since 2000 has a physical basis in grade and depth that would make its continuation the expected case? Whether leaching copper from tailings and stockpiles can be scaled? Section 2 sets out the data and the model, Section 3 provides the results, Section 4 is a discussion, including the comparison with BloombergNEF, and Section 5 concludes.
2. Data and method
2.1. The supply gap
The supply side in Simon et al. produced a database of 406 porphyry copper mines and projects (the SM2 database). The 112 porphyry mines operating in 2018 produced 15.66 million tonnes, and scaling their output by 1.3 to represent sediment-hosted, volcanogenic and other deposit types reproduces world mine production of 20.4 million tonnes in that year. Scheduled closures reduce that output to 17.8 million tonnes by 2050. Against baseline demand of 37.1 million tonnes, new mines must therefore supply 19.3 million tonnes a year by 2050. The same subtraction gives 20.0 million tonnes for the hybrid-vehicle scenario, 27.9 million tonnes for full vehicle electrification with grid expansion, and 73.9 million tonnes for the net-zero case. Recycling is already netted out, since the paper’s mined demand assumes secondary supply grows to 13.4 million tonnes by 2050, a quantity its authors describe as generous.
The 2018 mine output in 2025 and 2030 and the end point of the identified-project supply curve are computed from the SM2 database, following the convention of subtracting porphyry output lost to closures from 2018 world production. The 17.8 million tonne figure subtracts porphyry closures without the 1.3 scaling that the upper curve applies; scaling the closures as well would give 16.95 million tonnes and add about $19 billion to the base case, within the existing-mine band of the sensitivity analysis.
2.2. Capacity added since 2018
World Bureau of Metal Statistics data reported by Cochilco (2026a) put world mine production at 23.5 million tonnes in 2025, while the SM2 database places output from the 2018 fleet at 20.3 million tonnes in the same year. The difference, about 3.2 million tonnes, is output from mines opened or expanded since 2018, and we assume it persists to 2050. Built up from the database and company reports, it comprises about 0.8 million tonnes from new porphyry mines in the database, led by Quellaveco at 0.30 million tonnes and the Oyu Tolgoi underground mine at 0.16 million tonnes; 0.39 million tonnes from Kamoa-Kakula, a sediment-hosted deposit outside the porphyry database (Ivanhoe Mines, 2026); 0.17 million tonnes from the expansion of Quebrada Blanca and 0.08 million tonnes from the Spence expansion, both from Cochilco’s production data; and about 1.8 million tonnes from other expansions, other non-porphyry mines and ramp-ups, which the database does not capture because it holds each operating mine at its 2018 output. Cobre Panama, which opened in 2019 and was ordered closed in late 2023, is not producing and is excluded. Output in 2025 was also depressed by the seismic event at Kamoa-Kakula in May, the collapse at El Teniente in July and the mud rush at Grasberg in September, so the 3.2 million tonnes is a net figure that probably understates the capacity built since 2018.
Removing it leaves 16.1 million tonnes a year of new output that still requires investment from 2026 onward, and that forward-looking figure is the base case throughout this paper (Figure 1). The USGS’s rounded estimate of 23.0 million tonnes for 2025 (USGS, 2026) would instead give about 2.7 million tonnes, a forward gap of 16.6 million tonnes and a base case of about $372 billion; the WBMS series is used because it also reproduces Simon et al. (2026) 20.4 million tonnes for 2018. More than half of the 3.2 million tonnes, about 1.8 million tonnes, is a residual not traced to named mines, and the choice of the WBMS over the USGS figure adds 0.5 million tonnes to that residual rather than to the traced components.
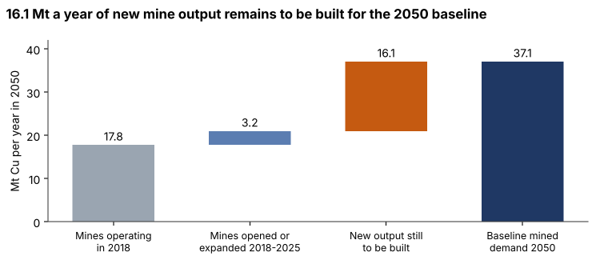
Figure 1. Composition of 2050 baseline mined copper demand. Sources: Simon et al. (2026)
2.3. Capital intensity
Capital intensity, the development cost of a mine divided by its annual output, is the simplest way to price new supply. Simon et al. (2026) reports these values in 2024 dollars per tonne of copper equivalent produced annually. The global average was $4,000 to $5,000 in 2000 and tripled between 2001 and 2010. The 26 projects being developed for start-up by 2030 range from $9,867 to $55,347, with an average of $22,359 (Sy et al., 2025). Most of these projects are small. Simon et al. (2026) notes that 18 of the 26 will produce less than 50,000 tonnes a year and only two more than 100,000 tonnes, so a simple average and an output-weighted average could differ materially. The output-weighted figure is the relevant one for pricing the gap, because a few large projects will supply most new output. Small projects usually carry higher capital intensity, which would put an output-weighted average below $22,359, but two of the largest recent projects, Quebrada Blanca Phase 2 at $28,344 and Cobre Panama at $31,318, sit well above it, so the direction of the correction is not certain. The S&P dataset behind the average would allow it to be computed directly. Named examples include Oyu Tolgoi in Mongolia at $18,916, Cobre Panama at $31,318, Esperanza Sur in Chile at $30,296 and Gunnison in Arizona at $29,614. Ten Latin American brownfield projects developed between 2020 and 2024 averaged $23,000 (Farrell and Whitton, 2024), which removes the usual presumption that expanding existing mines is much cheaper than building new ones.
Company disclosures for three large recent projects fall within the same band once converted to 2024 dollars with the consumer price index (U.S. Bureau of Labor Statistics, 2025). Anglo American (2022) put the total cost of Quellaveco in Peru at $5.5 billion for about 300,000 tonnes of copper equivalent a year over its first decade, or $19,651 per tonne in 2024 dollars. Teck guided the cost of Quebrada Blanca Phase 2 in Chile to $8.6 to $8.8 billion (Teck Resources, 2023) against 316,000 tonnes of copper-equivalent output in its first five full years (Teck Resources, 2021), or $28,344. Ivanhoe estimated the remaining Phase 3 cost at Kamoa-Kakula in the Democratic Republic of the Congo at $3.0 billion, including a smelter and off-site hydropower (Ivanhoe Mines, 2023), for an increase from about 450,000 (Ivanhoe Mines, 2022) to 600,000 tonnes a year (Ivanhoe Mines, 2024), or $20,590 per incremental tonne. The weighted cost of new supply implied by BHP’s estimate that $250 billion of expansion capital will be needed for 10 million tonnes of new mined supply over 2025 to 2034 is $25,000 (Farrell and Whitton, 2024). Figure 2 presents the benchmarks.
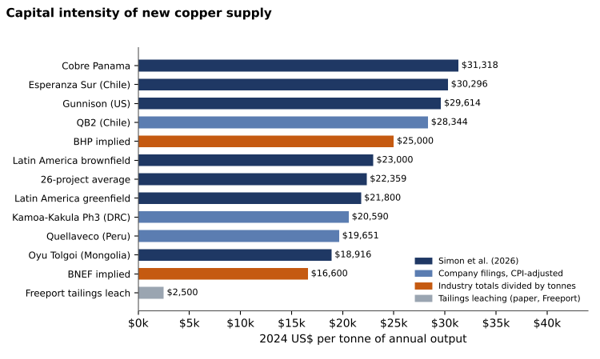
Figure 2. Capital intensity benchmarks in 2024 US dollars per tonne of annual output. Company figures converted with CPI-U annual averages (U.S. Bureau of Labor Statistics, 2025).
Leaching low-grade material on existing leach pads costs a fraction of any mine benchmark. Freeport-McMoRan aims eventually to add about 360,000 tonnes a year (800 million pounds) by leaching material already placed on the leach stockpiles at its U.S. operations, copper it had previously treated as waste, for about $1 billion against roughly $10 billion for a new mine of similar output (Mining Weekly, 2025).
2.4. Model
Investment equals the gap divided by realized utilization, multiplied by capital intensity and by an escalation factor of one plus the real escalation rate raised to the number of years between 2026 and the capital-weighted midpoint of 2038, and by one plus any cost-overrun allowance, plus any stockpile or tailings capacity priced at its assumed treatment cost. The base case sets utilization to 100%, escalation and overrun to zero and tailings to zero, which reproduces 16.1 million tonnes multiplied by $22,359, or $360 billion. Company costs are converted to 2024 dollars by the ratio of 2024 CPI-U to the reference-year CPI-U. The estimate covers development capital for new mine output only and excludes sustaining capital, smelting and refining capacity, exploration and financing costs. All model figures are in 2024 dollars. Company figures from other years are converted with CPI-U annual averages, using the January to September mean for 2025 and an assumed 2.5% inflation rate for 2026, and where a source states no dollar basis the text says so.
Nine drivers are varied one at a time around the base case: 2050 total supply, recycling, 2018-fleet output in 2050, capacity added since 2018, tailings supply, realized utilization, capital intensity, real escalation and cost overrun. The recycling, existing-mine and cost-overrun bands are illustrative assumptions; the others are taken from Simon et al. (2026), from BloombergNEF (2026), from the long-run ICSG utilization rate (ICSG, 2018) and from company disclosures.
The base-case gap is allocated across producing regions in three ways: in proportion to each region’s share of 2025 mine production and in proportion to its share of reserves, both from USGS (2026), and by where the SM2 database places the announced projects due to start in 2025 or later. Each region’s tonnage is priced at the closest available benchmark, with the pipeline average used for Russia, China, Australia and the residual group. The USGS country shares are applied to the WBMS-based forward gap.
3. Results
3.1. The investment requirement
Multiplying the 16.1 million tonne forward gap by the $22,359 pipeline average gives a base-case requirement of $360 billion. Table 1 repeats the calculation for each demand scenario and for the benchmarks. Across Simon et al. (2026) named projects, the baseline requirement ranges from $304 billion to $504 billion. The hybrid scenario adds little, at $376 billion, because a hybrid fleet needs only 0.7 million tonnes more copper a year than the baseline. Full electrification with grid expansion requires $552 billion, and the net-zero case requires about $1.6 trillion (Figure 3).
Table 1. Investment required from 2026 by scenario and capital intensity (2024 US$ billion)
|
Gap case (Mt/yr) |
Oyu Tolgoi $18,916 |
Quellaveco $19,651 |
26-project avg $22,359 |
BHP implied $25,000 |
Cobre Panama $31,318 |
|
Forward baseline (16.1) |
304 |
316 |
360 |
402 |
504 |
|
Baseline with tailings at $2,500/t (12.1) |
239 |
248 |
280 |
312 |
389 |
|
Baseline with tailings at $10,000/t (12.1) |
269 |
278 |
310 |
342 |
419 |
|
Baseline with tailings at $15,000/t (12.1) |
289 |
298 |
330 |
362 |
439 |
|
Baseline with 2.0 Mt tailings at $5,000/t (14.1) |
277 |
287 |
325 |
362 |
451 |
|
Hybrid (16.8) |
318 |
330 |
376 |
420 |
526 |
|
EV + grid (24.7) |
467 |
485 |
552 |
617 |
773 |
|
Net zero (70.7) |
1,337 |
1,389 |
1,581 |
1,767 |
2,214 |
|
Full period 2018-50, baseline (19.3) |
365 |
379 |
432 |
483 |
604 |
Investment = gap x capital intensity / 1,000. The tailings row prices 12.1 Mt of mines plus 4.0 Mt of leaching at $2,500/t ($10 billion). The three rows below it price the same 4.0 Mt at $10,000/t ($40 billion) and $15,000/t ($60 billion), and a cautious case of 2.0 Mt at $5,000/t ($10 billion) with 14.1 Mt of mines; the $5,000, $10,000 and $15,000 figures are illustrative assumptions.
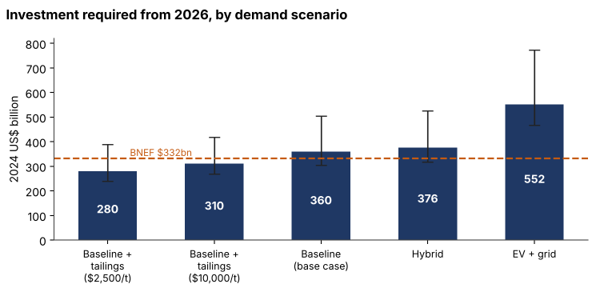
Figure 3. Investment required from 2026 by demand scenario, with the range across named projects.
The full-period figure of $432 billion answers a different question. It prices all 19.3 million tonnes of new output that the 2018 mines cannot supply, including the 3.2 million tonnes already built, valued at today’s costs at about $72 billion.
3.2. Identified projects and candidate deposits
Our project pipeline indicates how much of this output has been identified. Its upper supply curve, which assigns plausible start dates to 198 mines and projects with known or announced production, reaches about 32.5 million tonnes in 2050 in the SM2 database. Identified projects account for roughly 14.7 million tonnes of the 19.3 million tonne full-period gap, and about 4.6 million tonnes must come from mines not yet identified, from tailings, or from other sources. Part of this identified output has been built since 2018, and the rest has yet to secure the capital and permits required.
Lead times limit where that 4.6 million tonnes can come from. With new mines taking about 17 years on average from discovery to production (BloombergNEF, 2026), a deposit discovered after the early 2030s is unlikely to produce by 2050, so the balance must come mainly from deposits that are already known, or from tailings and stockpiles. The database lists 208 deposits without announced production. Setting aside 23 listed as closed, 20 listed as operating and 15 others that started before 2018, and one duplicate entry, leaves 149 unbuilt candidates. Together they contain about 321 million tonnes of copper at a tonnage-weighted grade of 0.37%, against 0.50% for the mines operating in 2018. Chile holds a third of that copper, led by Pampa Escondida and Los Sulfatos, and the rest is spread over more than 30 countries. Most candidates are small: 81 contain less than 2 million tonnes of copper, whereas only 20 of the 112 mines operating in 2018 were that small. Their median discovery year is around 1993, so most have been known for decades without being developed. If every candidate were built and produced at the same rate relative to its contained copper as the 2018 fleet, about 1.1% a year, together they would supply about 3.6 million tonnes a year, short of the 4.6 million tonnes needed. The 41 candidates with at least 2 million tonnes of contained copper would supply about 2.6 million tonnes. Known deposits alone therefore appear unlikely to close the gap, which leaves expansions of existing mines, tailings and stockpiles to make up the balance. Exploration and discovery spending, which this paper excludes, matters mainly for supply after 2050.
3.3. What drives capital intensity
A copper mine is sized by the ore it must move and process, not by the copper it sells. The tonnes of ore that must be mined and milled for each tonne of copper equal one divided by the product of head grade and metallurgical recovery. At a head grade of 0.6% and 85% recovery, a concentrator must treat about 196 tonnes of ore for each tonne of copper. At 0.4% the figure rises to about 294 tonnes, an increase of half. The mining fleet, crushing and grinding circuits, flotation cells, tailings storage, water supply and power demand all scale with ore throughput, so the capital needed per tonne of annual copper output rises as grade falls even if the cost of each piece of equipment does not change.
Grade has been falling for decades. Mudd and Jowitt (2018) document the long decline in the average grade of copper ore mined worldwide, and the decline is most pronounced in Chile, where the average grade of ore processed fell from 1.10% in 2002 to 0.58% in 2025, and at concentrators from 1.22% to 0.69% (Cochilco, 2026a). At 85% recovery that raised the ore needed for each tonne of copper from about 107 tonnes to about 203 tonnes. Cochilco’s energy data show the mechanism at work: between 2005 and 2024 the electricity used at Chilean concentrators rose from about 7,200 to 13,100 megajoules per tonne of copper, and at underground mines, which are getting deeper, from about 1,600 to 3,900 megajoules. Over 2005 to 2025 Cochilco’s index of real total unit costs at Codelco and the large private producers rose 2.7-fold. The SM2 database shows that the next generation of mines will continue the trend. The announced projects due to start in 2025 or later have a tonnage-weighted reserve grade of 0.44%, about 10% below the 0.50% of the mines operating in 2018, and the 149 candidate deposits without announced production average 0.37%, about 25% lower. These are tonnage-weighted grades of reserves and resources reported in 2017, not head grades, and the weighting matters. Weighted by expected output, the announced pipeline grades 0.55% against 0.54% for the 2018 fleet, because a few large, high-grade projects dominate expected production. The largest, Resolution in Arizona, grades about 1.5% copper in the database but lies more than 1.5 kilometres below the surface, so its high grade comes with the deep block-cave development that raises capital per tonne by another route.
New supply increasingly comes from deep underground block caves such as Oyu Tolgoi, the Grasberg Block Cave, Chuquicamata Underground and El Teniente’s New Mine Level, and from proposed caves such as Resolution in Arizona, where the ore lies more than 1.5 kilometres below the surface. Block caves need years of underground development before the first ore is drawn, which raises capital per tonne and pulls spending forward. In northern Chile, high-altitude projects such as Quebrada Blanca Phase 2 must pump desalinated seawater well over 100 kilometres inland and more than 4,000 metres uphill, and new tailings facilities must now meet the Global Industry Standard on Tailings Management adopted in 2020 (ICMM, UNEP and PRI, 2020).
This offers a way to test the escalation rates used in the sensitivity analysis. Suppose capital intensity scales with ore throughput per tonne of copper raised to an exponent between about 0.6, when larger single processing lines capture economies of scale, the six-tenths rule of process plant estimating, and 1, when capacity is added by replicating lines. At an exponent of 0.8, the 10% grade gap between announced projects and today’s mines raises capital intensity by about 9%, equivalent to 0.7% a year over the 12 years to the 2038 midpoint, and the 25% gap for the unannounced candidates raises it by about 25%, or 1.9% a year. Chile’s grade decline from 2002 to 2025, 2.7% a year, translates into about 2.3% a year of escalation at the same exponent. Weighted by output, the announced pipeline shows almost no grade effect. Grade alone therefore accounts for between almost nothing and about two-thirds of the 3.4% a year trend in the data, and depth, altitude, water and tailings standards plausibly account for much of the rest.
3.4. Tailings and low-grade stockpiles
Simon et al. estimate that leaching could add 4.0 million tonnes a year and the $2,500 per tonne cost taken from Freeport refer to different materials. Three kinds of low-grade material are involved. The first is ore and low-grade material already stacked on leach pads and stockpiles, mostly at mines with oxide or supergene chalcocite ore. This is what Freeport is targeting: it describes about 39 billion pounds of copper in material already placed on its stockpiles that it had treated as waste, which it is recovering with data analytics, deeper solution injection and other operational changes (Mining Weekly, 2025). The pads, solution collection systems and solvent extraction and electrowinning plants already exist, which is why the incremental capital is so low. Chile’s output of SX-EW cathode has fallen from 2.1 million tonnes in 2009 to 1.1 million tonnes in 2025 as oxide ores have been worked out (Cochilco, 2026a), so some tankhouse capacity may be available to take copper leached from stockpiles at similarly low cost. The second is low-grade sulfide rock in waste dumps. The third, and by far the largest by mass, is flotation tailings, the finely ground residue of concentrators held in impoundments.
Flotation tailings are a much harder target than leach pads. They are ground to fine sand and silt, typically finer than about 150 to 200 micrometres, and so lack the permeability needed for heap leaching unless they are agglomerated or treated in tanks. Their residual copper is mostly in chalcopyrite, which passivates and leaches slowly in conventional acid and ferric sulfate systems, and it sits alongside abundant pyrite. Recovering it requires newer process routes such as catalyzed leaching, heated bioleaching, or reflotation followed by concentrate processing, and new plants to run them. Commercial reprocessing remains small. Minera Valle Central, which retreats fresh and historical tailings from El Teniente in Chile and is among the largest such operations, produced about 29,000 tonnes of copper in 2024 (Amerigo Resources, 2025). The capital cost per tonne of copper recovered from flotation tailings is therefore likely to be well above Freeport’s $2,500 and may be a substantial fraction of the cost of a new mine.
Simon et al. figure of about 100 billion tonnes of tailings at an average of 0.46% copper implies roughly 460 million tonnes of contained copper. Supplying 4.0 million tonnes a year from 2026 to 2050 would mean recovering about 100 million tonnes, or about 22% of that endowment. Much of the mass sits in thousands of facilities, many of them small, closed, revegetated or far from processing infrastructure, and reworking an impoundment raises geotechnical and water-management issues of its own. Older tailings, produced when recoveries were lower, generally carry higher residual grades, so the accessible high-grade fraction near operating mines may matter more than the global total.
If all 4.0 million tonnes could be recovered at Freeport’s $2,500 per tonne, the baseline requirement falls from $360 billion to $280 billion. At $10,000 per tonne it falls only to $310 billion, and at $15,000 per tonne to $330 billion. The $5,000, $10,000 and $15,000 figures are illustrative assumptions rather than sourced costs. A more cautious case of 2.0 million tonnes a year at $5,000 per tonne gives $325 billion. Tailings remain the cheapest source of new copper in the analysis, and reprocessing sulfidic tailings can also remove pyrite and reduce long-term acid drainage liabilities (Adrianto and Pfister, 2022). Even so, the 4.0 million tonne figure is best treated as an upper bound on supply and $2,500 as a lower bound on cost. The cost bound is less restrictive than it may appear for stockpile material. Freeport’s own operating improvements are proprietary, but the catalytic and bacterial leach routes that unlock chalcopyrite in stockpiles are being commercialised by third parties: Jetti Resources’ catalytic leach has operated at Capstone’s Pinto Valley since 2019, with BHP and Freeport among Jetti’s investors (Mining.com, 2021), and Rio Tinto’s Nuton bioleach produced its first copper cathode at Gunnison Copper’s Johnson Camp mine in Arizona in November 2025 (Rio Tinto, 2025).
3.5. The 2030 checkpoint
Simon et al. measures near-term pressure against 2018 output, noting that baseline demand of 26.3 million tonnes in 2030 exceeds 2018 production by 5.9 million tonnes while the 26 projects scheduled to start by 2030 would supply 1.65 million tonnes if all proceed on time. Measured from today, the remaining 2030 requirement is smaller. After allowing for the decline of the 2018 fleet to about 19.8 million tonnes and for the output already added since 2018, about 3.3 million tonnes of new output is still needed by 2030. The pipeline covers 50% of that, leaving 1.7 million tonnes uncovered. If the pipeline average applies to output, the 26 projects represent roughly $37 billion of capital, and the uncovered output a further $37 billion. BloombergNEF (2026) puts the average time to bring a new mine into operation at 17 years, and even a permitted project needs several years from a construction decision to first output, so capital committed now could close little of the 2030 shortfall beyond what the 26 projects already represent. It will be absorbed through higher prices, drawdowns of inventory and demand restraint, while the capital decisions of the next few years determine the position in the 2040s.
3.6. Sensitivity
Figure 4 varies each driver of the base case while holding the others fixed. Demand produces the widest swing, from $259 billion if 2050 demand were BloombergNEF’s 46 million tonnes to $552 billion under electrification with grid expansion. Capital intensity in Simon et al. (2026) named projects makes the total between $304 billion and $504 billion. Real cost escalation is the third large driver. The $22,359 average is an estimate published in December 2025 (Sy et al., 2025) for projects due to start production by 2030, so the rise from about $13,500 in 2010 spans 15 years and implies a real increase of 3.4% a year. BHP’s figures for Latin American brownfield projects imply 3.6% a year over 2010 to 2024 (Farrell and Whitton, 2024). Carried forward to a capital-weighted midpoint of 2038, those rates raise the base case to $539 billion and $553 billion respectively, or about $545 billion.
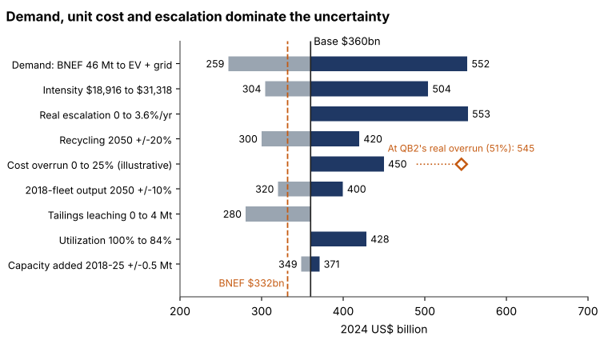
Figure 4. One-way sensitivity around the base case. The recycling, existing-mine and cost-overrun bands are illustrative assumptions.
A 20% shortfall in recycling, the requirement to $420 billion. Output from the 2018 fleet 10% below Simon et al. (2026) 2050 projection raises it to $400 billion. Cochilco’s data suggest the downside is the more likely direction. Chilean mine output fell from 5.83 million tonnes in 2018 to 5.39 million tonnes in 2025 even though Quebrada Blanca Phase 2 and the Spence expansion added about 0.24 million tonnes, so Chile’s existing mines produced roughly 12% less, whereas the database holds each mine at its 2018 output until it closes. Mines rarely run at design output, and if the pipeline’s capital intensities describe design rather than realized production, the long-run ICSG utilization rate of about 84% (ICSG, 2018) lifts the base case to $428 billion. Uncertainty in the capacity added since 2018 matters least, at about $11 billion either way. Stacking every unfavorable input produces about $2.1 trillion and stacking every favorable one produces $60 billion, which are arithmetic bounds rather than scenarios. Capital intensities based on project budgets also leave out cost overruns, which are common in large mine developments. Quebrada Blanca Phase 2 was sanctioned in December 2018 at $4.74 billion (Teck Resources, 2018) and completed at $8.6 billion to $8.8 billion, an overrun of about 84% in nominal terms and about 51% after inflation. Cochilco’s capital expenditure data, which also include sustaining capital, record about $11 billion spent at Quebrada Blanca between 2018 and 2025. A 25% overrun allowance applied to all new projects would raise the base case to about $450 billion, and it is included as a ninth driver in the sensitivity analysis.
Six of the nine drivers can pull the total down, by at most about $101 billion, while escalation, utilization and cost overruns can only push it up and the upward swings for demand, capital intensity and escalation reach $144 billion to $193 billion. The outcome distribution is therefore skewed upward. Figure 5 shows every combination of gap and unit cost.
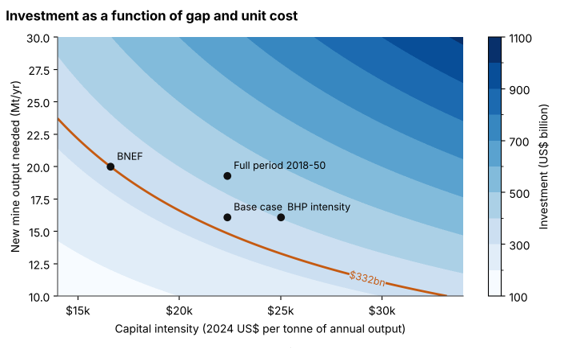
Figure 5. Investment as a function of the gap and capital intensity. The orange curve marks combinations equal to BloombergNEF’s $332 billion.
3.7. Regional distribution
Table 2 and Figure 6 show the three allocations. The production and reserve rules both give about $380 billion, slightly above the base case, because Chile, priced near $30,000 per tonne, accounts for 23% of production and 18% of reserves.
Table 2. Regional allocation of the forward baseline gap
| Region | Production share | Reserve share | Intensity 2024$/t (basis) | By production ($bn) | By reserves ($bn) | Pipeline share | By pipeline ($bn) |
| Chile | 23.0% | 18.4% | 30,296 (Esperanza Sur) | 112 | 90 | 30.0% | 146 |
| Peru | 11.7% | 8.7% | 19,651 (Quellaveco) | 37 | 27 | 11.5% | 36 |
| DRC and Zambia | 18.0% | 10.3% | 20,590 (Kamoa-Kakula Ph3) | 60 | 34 | 0.0% | 0 |
| North America | 9.5% | 10.9% | 25,000 (Freeport new mine) | 38 | 44 | 17.1% | 69 |
| Indonesia and Kazakhstan | 6.2% | 4.2% | 18,916 (Oyu Tolgoi, proxy) | 19 | 13 | 4.4% | 13 |
| Russia | 5.6% | 8.2% | 22,359 (pipeline avg) | 20 | 29 | 3.3% | 12 |
| China | 7.8% | 4.2% | 22,359 (pipeline avg) | 28 | 15 | 3.5% | 12 |
| Australia | 3.2% | 10.2% | 22,359 (pipeline avg) | 11 | 37 | 0.0% | 0 |
| All other countries | 14.9% | 25.0% | 22,359 (pipeline avg) | 54 | 90 | 30.3% | 109 |
| World | 100% | 100% | 23,590 / 23,544 / 24,729 | 380 | 379 | 100% | 398 |
Shares from USGS (2026), 2025 estimates, applied to the WBMS-based forward gap. Each regional intensity rests on one project or a proxy; the Freeport figure is a company round number in nominal dollars. Pipeline shares follow the 2050 output of SM2 projects due to start in 2025 or later; SM2 covers porphyry deposits only.
Chile carries the largest single-country requirement, $90 billion to $112 billion, because it combines the largest production base with costs of the kind seen at Esperanza Sur and Quebrada Blanca. The Central African Copperbelt is among the cheaper sources per tonne, but its share falls from $60 billion to $34 billion when allocation follows reserves rather than current output. Moving to the reserves rule shifts roughly $25 billion toward Australia and $36 billion toward the residual group, which includes Panama, Argentina and Mongolia, where permitting and political risk are high. The third rule allocates the gap according to where the SM2 database places the announced projects due to start in 2025 or later. On that basis Chile takes 30% of the gap and $146 billion, North America 17% and $69 billion, and the residual group 30% and $109 billion, led by Argentina, Ecuador, Mongolia and Papua New Guinea. The total rises to $398 billion, an average of about $24,700 per tonne. Because the database covers porphyry deposits only, this rule assigns nothing to the sediment-hosted Central African Copperbelt or to Australia, whose large deposits are iron oxide-copper-gold and sediment-hosted, and overstates the share of porphyry regions.
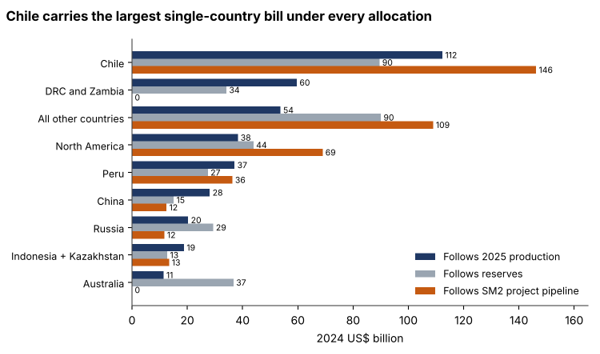
Figure 6. Base-case investment by region under three allocation rules.
4. Discussion
4.1. Spending in context
Spread evenly across 2026 to 2050, the base case requires about $14 billion a year. Because new mines take close to two decades to reach production, most of the capital for 2050 output must be committed by the mid-2040s, which raises the annual rate to about $18 billion. BHP expects about $25 billion a year of expansion capital to be needed through 2034, in 2024 dollars (Farrell and Whitton, 2024). It also reports that the industry spent around $150 billion on copper projects in the decade to 2024, or $15 billion a year, although it does not say whether that figure includes sustaining capital or whether it is in nominal or 2024 dollars; if nominal, it is about $180 billion in 2024 dollars.
Disclosures from two companies put it at about $1,200 to $1,810 per tonne of copper produced in 2024 dollars: Antofagasta spent $1.22 billion in 2025 to produce 654,000 tonnes (Antofagasta plc, 2026), and Capstone Copper guides $270 million for 2026 on output of 200,000 to 230,000 tonnes (Capstone Copper, 2026), both deflated with the consumer price index. Applied to existing mines averaging about 22 million tonnes a year over 2026 to 2050, that is roughly $27 billion to $40 billion a year, or about $670 billion to $1.0 trillion in total, an order of magnitude rather than an estimate. New mines would add a further $240 billion to $370 billion as they come into production. The figures are consistent with the observation that sustaining capital has accounted for half or more of annual mining capital expenditure in recent years (Bain & Company, 2025). Cochilco’s data give a national cross-check: Chile’s large copper and gold miners spent $15.5 billion on capital in 2025, about $2,900 per tonne of the country’s mine output in nominal terms, a figure that covers sustaining and growth capital together (Cochilco, 2026a). The industry already funds that stream, so the development capital estimated here is an increment of roughly $14 billion to $18 billion a year on top of it rather than a new order of spending. The constraint lies in permitting, community consent and price signals strong enough to justify committing capital at today’s capital intensities.
4.2. Comparison with BloombergNEF
BloombergNEF’s Transition Metals Outlook 2026, puts the cost of new copper mines needed by 2050 at $332 billion to close a deficit of 20 million tonnes, about 44% of projected demand of almost 46 million tonnes (BloombergNEF, 2026). Its physical gap is close to ours, since our forward gap equals 43.4% of mined demand, although BloombergNEF does not state whether its supply balance includes recycled copper. The difference lies in cost. BloombergNEF’s totals imply $16,600 per tonne, 26% below the pipeline average and below every mine benchmark in Figure 2. Our forward gap reproduces $332 billion only at $20,625 per tonne, and the pipeline average reproduces it only if the gap shrinks to 14.8 million tonnes. Applying the pipeline average to BloombergNEF’s gap gives $447 billion. Its public release does not state the dollar basis or scope of the figure. BloombergNEF’s estimate is best read as a lower-cost estimate. It sits just above the stockpile-leaching cases in Table 1 and about 8% below the base case.
4.3. Incentive price and the cost of capital
Capital intensity is a cost per tonne of annual capacity and cannot be compared with the copper price directly, because doing so assumes that a mine repays its capital in a single year. Spread over a 25-year life at a real cost of capital of 8% to 12%, the $22,359 pipeline average corresponds to about $2,100 to $2,900 per tonne of copper produced, or roughly $2,900 to $3,900 before corporate tax at an illustrative 27% rate. The incentive price that new mines need is that capital charge plus all-in sustaining costs, royalties and a risk premium for difficult jurisdictions, and it is the incentive price that should be compared with today’s price of about $13,000 a tonne, which is about $12,400 in the 2024 dollars used for the capital charge. All-in sustaining costs are built here from company disclosures: the 2025 cash costs before by-product credits reported by Antofagasta, Southern Copper and Teck span $2.17 to $2.55 a pound, or about $4,700 to $5,500 a tonne in 2024 dollars, and adding the sustaining capital of $1,200 to $1,800 a tonne from Section 4.1 gives $5,900 to $7,300 a tonne (Antofagasta plc, 2026; Southern Copper, 2026; Teck Resources, 2026). The gross basis matches a capital intensity stated per tonne of copper equivalent, in which by-products are already credited. On that range the incentive price for a project at the pipeline average would be about $8,700 to $11,200 a tonne, below today’s price. At the pipeline maximum of $55,347, the pre-tax capital charge alone is about $7,100 to $9,700 a tonne, and the incentive price is about $13,000 to $17,000 a tonne before royalties and any jurisdiction premium, above today’s price.
The real yield on 10-year inflation-protected Treasuries stood at 2.6% in October 2026 against a mean of about 1.0% since the series began in 2003, so real rates are about one and a half to two percentage points above their long-run level (U.S. Department of the Treasury, 2026). Over a 25-year life, 1.6 points added to the discount rate raise the capital recovery factor by 11 to 14 percent and the pre-tax capital charge on the average pipeline project by about $400 to $450 a tonne, and by $1,000 to $1,100 a tonne at the pipeline maximum. The estimate in this paper is undiscounted and excludes financing costs, so a sustained rise in real rates does not change the $360 billion. Policies that lower the cost of capital or shorten development, such as offtake agreements, price floors and faster permitting, act directly on the variables that dominate the sensitivity results.
5. Conclusions
The capital needed to meet baseline copper demand is around $360 billion at current project costs and about $545 billion if real cost escalation continues at recent rates. Unit cost matters more than tonnage for this type of calculation, and the evidence on cost points upward, from the threefold rise in the 2000s to brownfield projects that now cost as much as greenfield ones, with falling grades and deeper ore bodies also putting upward pressure on the investment numbers. Leaching stockpiles and reprocessing tailings may help reduce the number, saving about $79 billion.
Most new mine output will be sold as concentrate (about 80% of world mine output in 2025 was concentrate rather than SX-EW cathode), a policy goal of secure supply implies further investment in smelting and refining. BloombergNEF’s $332 billion and the $360 billion estimated here describe the same gap at different unit costs. The open question for policy is not whether the capital exists but whether the price, the permits, and the cost of capital will allow it to be committed in time, and whether the industry can hold capital intensity near today’s level rather than on the trend of the past fifteen years.
References
Adrianto, L.R., Pfister, S., 2022. Prospective environmental assessment of reprocessing and valorization alternatives for sulfidic copper tailings. Resour. Conserv. Recycl. 186, 106567. https://doi.org/10.1016/j.resconrec.2022.106567
Amerigo Resources, 2025. Amerigo reports higher production from MVC and issues 2025 production outlook. https://www.nasdaq.com/articles/amerigo-resources-reports-higher-production-mvc-issues-fy25-production-outlook
Anglo American, 2022. Quellaveco achieves commercial production. JSE SENS announcement, 26 September 2022. https://senspdf.jse.co.za/documents/SENS_20220926_S466251.pdf
Antofagasta plc, 2026. Full year results for the year ended 31 December 2025. RNS, 17 February 2026. https://data.fca.org.uk/artefacts/NSM/RNS/27332ba5-3f88-41ac-9dc8-749869e0b0ef.html
Bain & Company, 2025. Sustaining capital: from chaos to discipline. Global Mining Review, 27 October 2025. https://www.globalminingreview.com/mining/27102025/sustaining-capital-from-chaos-to-discipline/
BloombergNEF, 2026. Transition Metals Outlook 2026. Press release, 20 October 2026. https://about.bnef.com/insights/commodities/bloombergnefs-transition-metals-outlook-2026-global-metal-supply-shortages-set-to-ease-but-copper-faces-a-332-billion-investment-gap/
Capstone Copper, 2026. Capstone Copper announces 2026 guidance. 17 February 2026. https://www.businesswire.com/news/home/20260217015477/en/Capstone-Copper-Announces-2026-Guidance
Cochilco, 2026a. Anuario de Estadísticas del Cobre y Otros Minerales 2025. Comisión Chilena del Cobre, Santiago. https://www.cochilco.cl/web/download/1036/2026/16853/anuario-de-estadisticas-del-cobre-y-otros-minerales-2025.pdf
Cochilco, 2026b. Base de Datos Anuario de Estadísticas Cochilco 2000-2025. Comisión Chilena del Cobre, Santiago. https://www.cochilco.cl/web/download/1036/2026/16850/base-de-datos-anuario-de-estadisticas-cochilco-2000-2025.xlsx
Farrell, S., Whitton, L., 2024. BHP Insights: how copper will shape our future. BHP, 30 September 2024. https://www.bhp.com/news/bhp-insights/2024/09/how-copper-will-shape-our-future
ICMM, UNEP, PRI, 2020. Global Industry Standard on Tailings Management. Global Tailings Review. https://globaltailingsreview.org/global-industry-standard/
ICSG, 2018. Copper mine capacity utilization 2008-2017. International Copper Study Group, Statistical Yearbook release, as reported by Recycling Portal. https://recyclingportal.eu/archive/45131
Ivanhoe Mines, 2022. Third quarter 2022 financial results. https://www.newsfilecorp.com/release/144113
Ivanhoe Mines, 2023. Ivanhoe Mines announces 2023 and 2024 capital expenditure guidance. 31 January 2023. https://www.ivanhoemines.com/?p=697
Ivanhoe Mines, 2024. Third quarter 2024 financial results. https://www.newsfilecorp.com/release/228310
Ivanhoe Mines, 2026. Ivanhoe Mines provides 2025 production results, 2026 production guidance. 15 January 2026. https://www.newsfilecorp.com/release/280491
Mining Weekly, 2025. Freeport targets low-cost copper gains with leaching technologies. 27 January 2025. https://www.miningweekly.com/article/freeport-targets-low-cost-copper-gains-with-leaching-technologies-2025-01-27
Mining.com, 2021. BHP, Freeport invest in Jetti Resources’ ‘holy grail’ copper extraction technology. 4 June 2021. https://www.mining.com/bhp-freeport-invest-in-jetti-resources-holy-grail-copper-extraction-technology/
Mudd, G.M., Jowitt, S.M., 2018. Growing global copper resources, reserves and production: discovery is not the only control on supply. Econ. Geol. 113 (6), 1235-1267. https://doi.org/10.5382/econgeo.2018.4590
Rio Tinto, 2025. Rio Tinto’s Nuton technology produces first copper. Press release, 4 December 2025. https://www.riotinto.com/en/news/releases/2025/rio-tintos-nuton-technology-produces-first-copper
Simon, A.C., Cathles, L.M., Wood, D., Bazilian, M., 2026. The widening gap between copper supply and demand will have an impact on economic development and energy futures. Energy Res. Soc. Sci. 133, 104581. https://doi.org/10.1016/j.erss.2026.104581
Southern Copper Corporation, 2026. Fourth quarter and year 2025 results. Form 8-K, Exhibit 99.1, 27 January 2026. https://www.sec.gov/Archives/edgar/data/1001838/000110465926007496/scco-20260127xex99d1.htm
Sy, D., Liwang, A.K., Manubag, N.M., 2025. Capital demands soar for new copper supply. S&P Global Market Intelligence, December 2025. https://www.spglobal.com/market-intelligence/en/news-insights/research/2025/12/capital-demands-soar-for-new-copper-supply
Teck Resources, 2018. Teck announces sanction of Quebrada Blanca Phase 2. Form 6-K, Exhibit 99.1, 4 December 2018. https://www.sec.gov/Archives/edgar/data/0000886986/000095014218002340/eh1801289_ex9901.htm
Teck Resources, 2021. Annual Information Form for the year ended 31 December 2020. Form 40-F exhibit. https://www.sec.gov/Archives/edgar/data/886986/000088698621000007/teck-20201231xexx991aif.htm
Teck Resources, 2023. Teck reports unaudited third quarter results for 2023. 23 October 2023. https://www.teck.com/news/news-releases/2023/teck-reports-unaudited-third-quarter-results-for-2023
Teck Resources, 2026. Teck 2025 Q4 financial report. 18 February 2026. https://www.teck.com/media/Teck-2025-Q4-Financial-Report.pdf
U.S. Bureau of Labor Statistics, 2025. Consumer Price Index for All Urban Consumers (CPI-U), U.S. city average, annual averages. As tabulated by Idaho Department of Labor. https://lmi.idaho.gov/wp-content/uploads/2025/12/2025-CPI.pdf
U.S. Department of the Treasury, 2026. Daily Treasury Par Real Yield Curve Rates, 10-year. Accessed 23 October 2026. https://home.treasury.gov/resource-center/data-chart-center/interest-rates/TextView?type=daily_treasury_real_yield_curve
U.S. Geological Survey, 2026. Mineral Commodity Summaries 2026: Copper. https://pubs.usgs.gov/periodicals/mcs2026/mcs2026-copper.pdf

ABOUT THE AUTHORS
Morgan Bazilian
Director, Payne Institute and Professor of Public Policy, Colorado School of Mines
Morgan Bazilian is the Director of the Payne Institute and a Professor of public policy at the Colorado School of Mines. Previously, he wD.as lead energy specialist at the World Bank. He has over two decades of experience in the energy sector and is regarded as a leading expert in international affairs, policy and investment. He is a Member of the Council on Foreign Relations.
Adam Simon
Professor of Earth and Environmental Sciences, University of Michigan
Adam Simon is Arthur F. Thurnau Professor of Earth and Environmental Sciences at the University of Michigan and Chief Scientist of VectOres Science, which applies patented technology to mineral exploration and processing. His expertise is in critical minerals and the use of metal isotopes in mining and environmental applications. He has published extensively, including the books Mineral Resources, Economics and the Environment and Earth Materials: Components of a Diverse Planet.
Macdonald Amoah
Independent Researcher
Macdonald is an independent researcher with interests across critical mineral supply chains, advanced manufacturing gaps, the defense industrial base, and the geopolitical risks of the mining sector.
Andrew Pederson
Associate Teaching Professor, Economics and Business, Colorado School of Mines
Pederson received his BA in economics from Pacific Lutheran University and has a MT in taxation from University of Denver’s College of Law. Pederson worked as an adjunct professor in the Division of Economics and Business at Mines, teaching engineering economics to undergraduate students. Pederson also served as a teaching assistant for the Division of Economics and Business and the Division of Chemical and Biological Engineering at Mines. He also worked with Investment Evaluations Corporation and lectured at Mines’ SPACE short courses as well as in-house courses for over 20 companies, teaching economic evaluation and investment decision methods.
Maxwell Brown
Assistant Professor, Economics and Business, Colorado School of Mines
Maxwell Brown is an Assistant Professor in the Department of Economics and Business at the Colorado School of Mines, a University Affiliate with the National Laboratory of the Rockies, and a Research Fellow with the Payne Institute for Public policy. His research uses economic and computational models to simulate energy systems and critical materials markets with a focus on the impacts of public policy and interactions with the broader economy. At Mines, he teaches computational economics, mathematical economics, as well as environmental and resource economics.
ABOUT THE PAYNE INSTITUTE
The mission of the Payne Institute at Colorado School of Mines is to provide world-class scientific insights, helping to inform and shape public policy on earth resources, energy, and environment. The Institute was established with an endowment from Jim and Arlene Payne and seeks to link the strong scientific and engineering research and expertise at Mines with issues related to public policy and national security.
The Payne Institute Commentary Series offers independent insights and research on a wide range of topics related to energy, natural resources, and environmental policy. The series accommodates three categories namely: Viewpoints, Essays, and Working Papers.
Visit us at www.payneinstitute.mines.edu
FOLLOW US


DISCLAIMER: The opinions, beliefs, and viewpoints expressed in this article are solely those of the author and do not reflect the opinions, beliefs, viewpoints, or official policies of the Payne Institute or the Colorado School of Mines.